¶ Charting
This page documents Charting features and usage for the Smart Pendant Extension SDK.
(available from API 2.2.0 and later)
¶ Overview
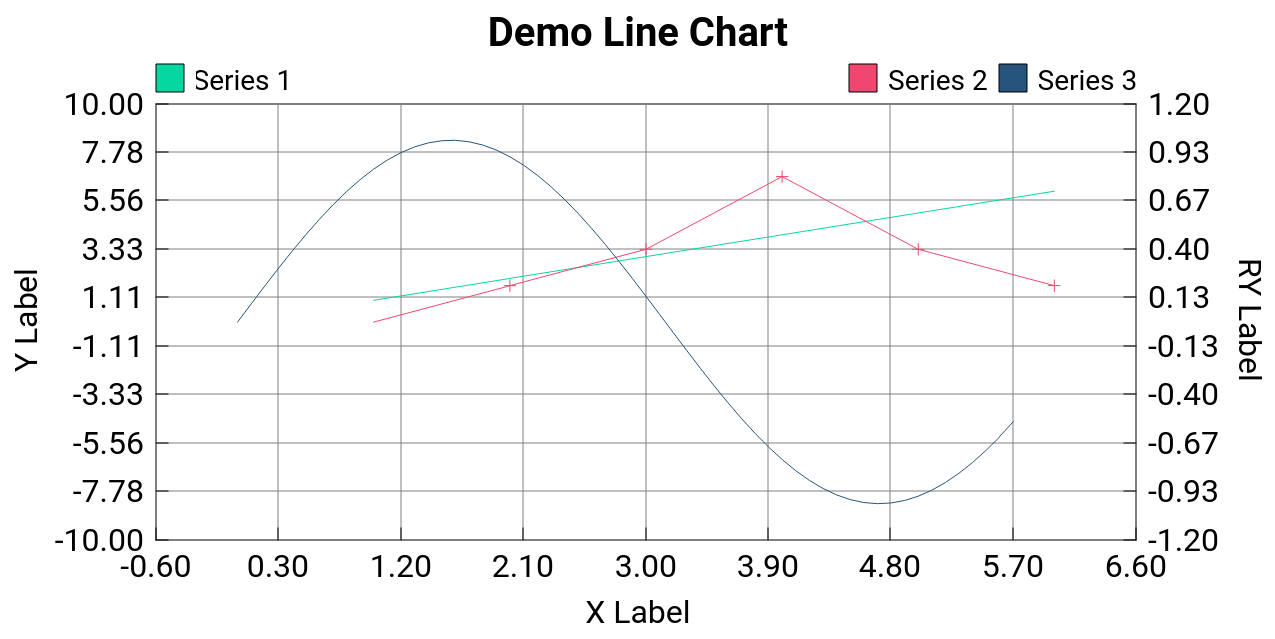
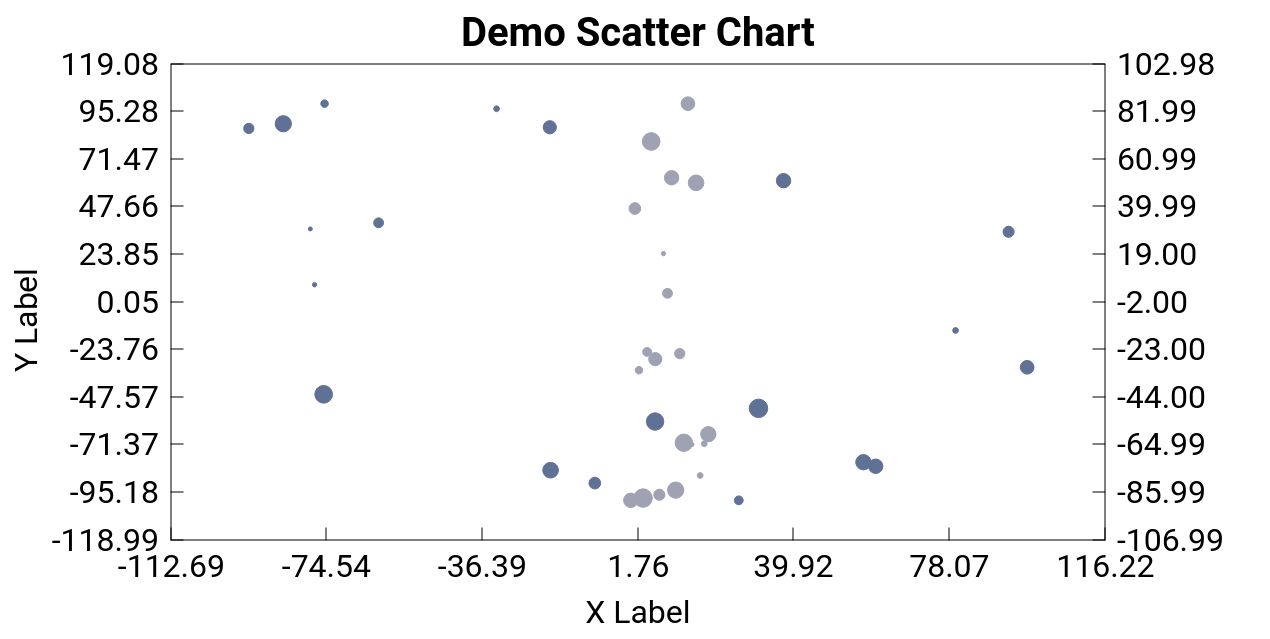
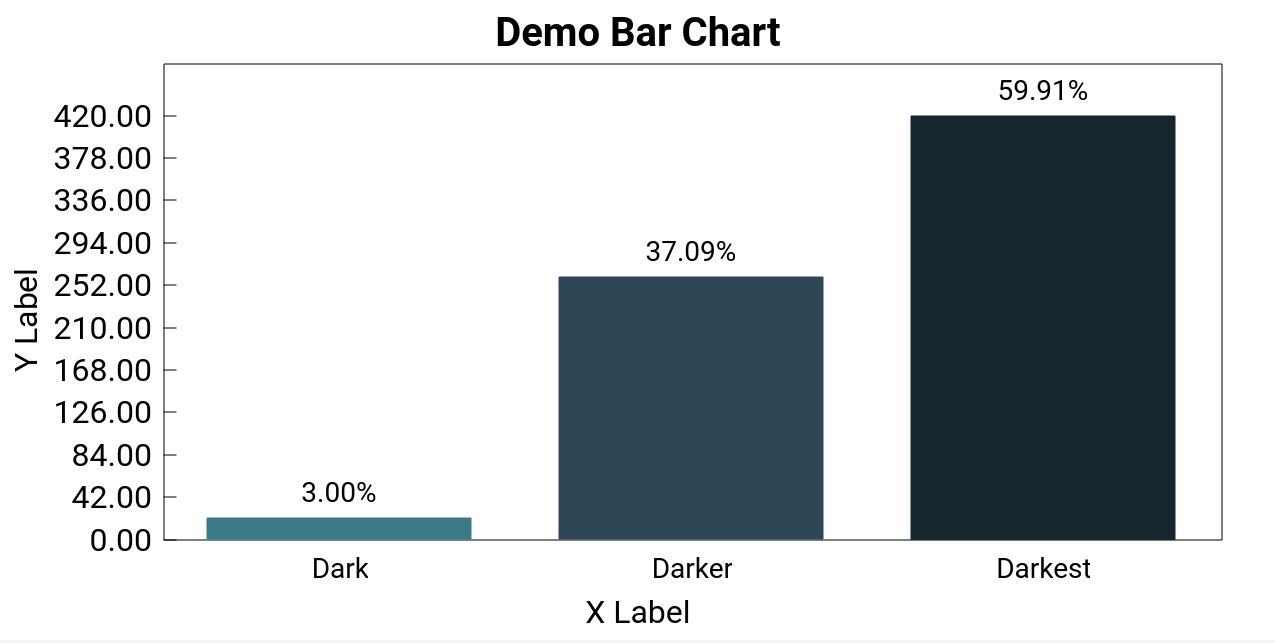
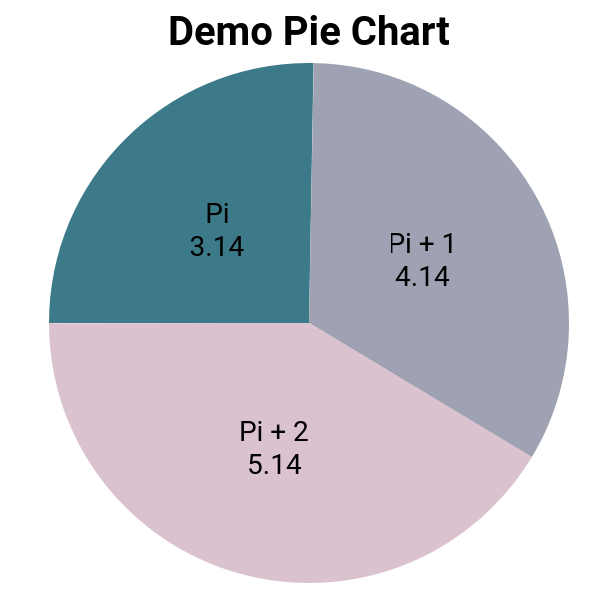
The Smart Pendant Extension SDK provides four basic chart types: line, scatter, bar, and pie charts, as well as functions for interacting with them. Below is a minimal example of some of the charting functionality, followed by more in-depth documentation of all the functionality available through the Smart Pendant Extension SDK.
¶ Example
This minimal example showcasing the charting features builds on the Java Quick-Start Guide, so be sure to go through that before attempting this example. Start by adding a LineChart under Column in MyUtility.yml, setting the width and height:
LineChart {
    id: exampleLineChart
    title: "Demo Line Chart"
    xlabel: "X Label"
    ylabel: "Y Label"
    width: 400
    height: 300
}
¶ Displaying Data
Next, we will add some code to MyExtension.java to demonstrate some of the functions of the charts. First we declare the onInit handler to initialize the line chart configuration and data:
void onInit(PendantEvent e)
{
        try {
        /* declare new series data */
        Series s1 = new Series(
        		Arrays.<Double>asList(1.0,2.0,3.0,4.0,5.0,6.0),
        		Arrays.<Double>asList(1.0,2.0,3.0,4.0,5.0,6.0)
        );
        s1.setColor("#06d6a0");

        /* add series data to new dataset */
        Map<String, Data> ds = new HashMap<String, Data>();
        ds.put("Series 1", Data.sData(s1));
        pendant.setChartData("exampleLine", ds);
    } catch (Exception ex) {
    		System.out.println("chart init failed: " + ex);
    }
}
Next, add the following line to the run function just before the call to extension.run(). This will ensure that the chart gets initialized when the MyUtility window is opened.
pendant.addEventConsumer(PendantEventType.UtilityOpened, this::onInit);
Finally, add the following import statements at the top:
import yaskawa.ext.api.Data;
import yaskawa.ext.api.Series;
import yaskawa.ext.api.DataPoint;
At this point you should be able to compile and run the extension and view the changes.
¶ Modifying Data
Next, we will take a look at how to add new data as it comes in. Add a private int clickCounter = 0; member to your MyExtension class. Next, add the following lines to the onClicked function:
try {
        DataPoint pt = new DataPoint(7+clickCounter, 7-clickCounter);
        pendant.appendChartPoint("exampleLine", "Series 1", pt);
        ++clickCounter;
} catch (Exception ex) {
        System.out.println("appendChartPoint failed: " + ex);
}
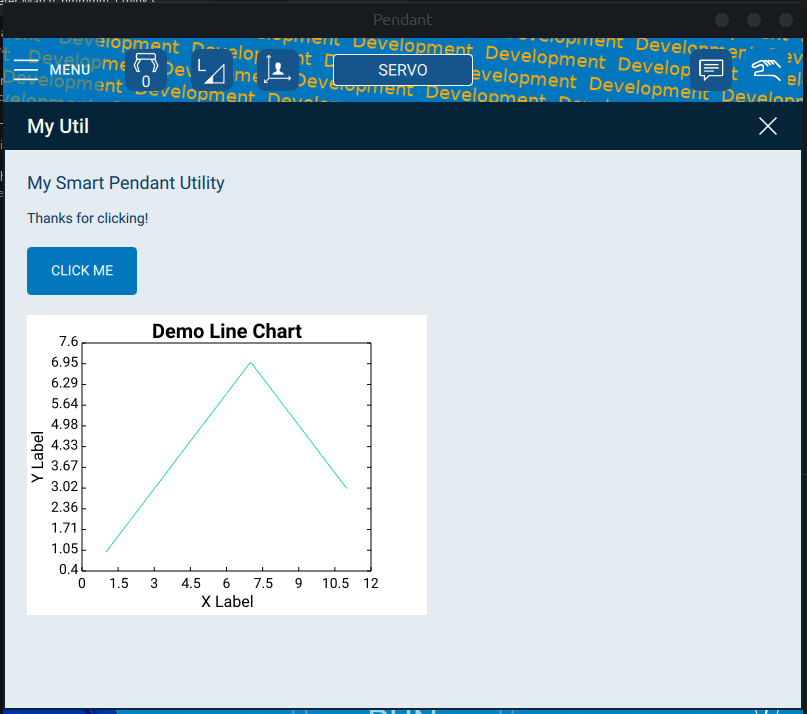
Now when you compile and run the extension again you should see points being added to the chart when you click the button, looking something like this after a few clicks:
¶ Full Example Source
The full modified sources are included below for reference:
¶ MyUtility.yml
MyUtility : Utility {
    Column {
        spacing: 20

        Label { text: "My Smart Pendant Utility" }

        Text {
    				id: message
            text: "Hello, World from a Java extension!"
        }

        Button {
    				id: mybutton
            text: "Click Me"
        }

                // following 5 lines are added by charting example
        LineChart {
        		id: exampleLine
            title: "Demo Line Chart"
            xlabel: "X Label"
            ylabel: "Y Label"
            width: 400
            height: 300
        }
    }
}
¶ MyExtension.java
import java.io.IOException;
import java.util.*;

import java.nio.charset.StandardCharsets;
import java.nio.file.Files;
import java.nio.file.Paths;

import org.apache.thrift.TException;
import org.apache.thrift.transport.TTransportException;

import yaskawa.ext.*;
import yaskawa.ext.api.PendantEvent;
import yaskawa.ext.api.PendantEventType;

/* following 3 imports are added by charting example */
import yaskawa.ext.api.Data;
import yaskawa.ext.api.Series;
import yaskawa.ext.api.DataPoint;

public class MyExtension {

    public MyExtension() throws TTransportException, Exception
    {
        var myExtVersion = new Version(1,0,0);
        var languages = Set.of("en");

        extension = new Extension("dev.my-extension", // canonical name
                                  myExtVersion,       // version of this extension
                                  "Acme Me",          // vendor
                                  languages);

        // obtain references to the Pendant and Controller API functions
        pendant = extension.pendant();
        controller = extension.controller();
    }

    protected Extension extension;
    protected Pendant pendant;
    protected Controller controller;

    public void run() throws TException, IOException, Exception
    {
        // Query the version of the SP API we're communicating with (different from the Smart Pendant app version):
        System.out.println("API version: "+extension.apiVersion());

        // Send a message to the SP log
        extension.info("Hello Smart Pendant, I'm MyExtension");

        // Register content of YML file with the pendant
        pendant.registerYMLFile("MyUtility.yml");

        // Register it as a Utility window
        pendant.registerUtilityWindow("myutil",    // id
                                      "MyUtility", // YML Item type
                                      "My Util",   // Menu name
                                      "My Util");  // Window title

        pendant.addItemEventConsumer("mybutton", PendantEventType.Clicked, this::onClicked);

        /* following line is added by charting example */
                pendant.addEventConsumer(PendantEventType.UtilityOpened, this::onInit);

        // run 'forever' (or until API service shuts down)
        extension.run(() -> false);
    }

    /* following function is added by charting example */
    void onInit(PendantEvent e)
    {
        try {
            /* declare new series data */
            Series s1 = new Series(
                Arrays.<Double>asList(1.0,2.0,3.0,4.0,5.0,6.0),
                Arrays.<Double>asList(1.0,2.0,3.0,4.0,5.0,6.0)
            );
            s1.setColor("#06d6a0");

            /* add series data to new dataset */
            Map<String, Data> ds = new HashMap<String, Data>();
            ds.put("Series 1", Data.sData(s1));
            pendant.setChartData("exampleLine", ds);
        } catch (Exception ex) {
            System.out.println("chart init failed: " + ex);
        }
    }

    /* following member is added by charting example */
    private int clickCounter = 0;

        void onClicked(PendantEvent e) {
        System.out.println("button clicked!");
        try {
            System.out.println("button clicked!");

            pendant.setProperty("message", "text", "Thanks for clicking!");

        } catch (Exception ex) {
            System.out.println("Unable to set message text property: "+ex.getMessage());
        }

        /* following 7 lines are added by charting example */
        try {
            DataPoint pt = new DataPoint(7+clickCounter, 7-clickCounter);
            pendant.appendChartPoint("exampleLine", "Series 1", pt);
            ++clickCounter;
        } catch (Exception ex) {
            System.out.println("appendChartPoint failed: " + ex);
        }
    }

    public static void main(String[] args)
    {
        try {

            MyExtension myExtension = new MyExtension();
            myExtension.run();

        } catch (Exception e) {
            System.out.println("Exception: "+e.toString());
        }

    }

}
¶ YML
The YML for declaring charts is very simple. Corresponding to the four supported chart types, there are four YML types:
LineChart
ScatterChart
BarChart
PieChart
All four of these types inherit from the Item type.
¶ LineChart
¶ Properties
string title- chart titlestring xlabel- x-axis labelstring ylabel- y-axis labelstring rylabel- right y-axis labelstring background- RGB hex string specifying the chart margin colorstring chartbackground- RGB hex string specifying the chart area colorbool grid- whether or not to display a grid on the chart area
¶ ScatterChart
¶ Properties
string title- chart titlestring xlabel- x-axis labelstring ylabel- y-axis labelstring rylabel- right y-axis labelstring background- RGB hex string specifying the chart margin colorstring chartbackground- RGB hex string specifying the chart area colorbool grid- whether or not to display a grid on the chart area
¶ BarChart
¶ Properties
string title- chart titlestring xlabel- x-axis labelstring ylabel- y-axis labelstring background- RGB hex string specifying the chart margin colorstring chartbackground- RGB hex string specifying the chart area colorbool grid- whether or not to display a grid on the chart areastring display- {'none','value','percent'} label for categorical charts
¶ PieChart
¶ Properties
string title- chart titlestring background- RGB hex string specifying the chart margin colorstring chartbackground- RGB hex string specifying the chart area colorstring display- {'none','value','percent'} label for categorical charts
¶ Extension API
The Charting features add the following data structures and functions for configuring and sending data to declared charts.
¶ Data Structures
¶ Struct: Series
| Key | Field | Type | Description | Requiredness | Default Value |
|---|---|---|---|---|---|
| 1 | x | Vector | x-values | default | undefined |
| 2 | y | Vector | y-values | default | undefined |
| 3 | z | Vector | z-values (scatter chart only) | optional | undefined |
| 4 | color | string | RGB hex string | optional | #000000 |
| 5 | vertex | string | one of star, cross, circle, square, or none |
optional | none |
| 6 | style | string | [TODO] | optional | "none" |
| 7 | hidden | bool | whether or not the Series is visible on the chart | optional | false |
| 8 | maxPts | i32 | maximum number of points to render | optional | undefined |
¶ Struct: Category
| Key | Field | Type | Description | Requiredness | Default Value |
|---|---|---|---|---|---|
| 1 | v | double | value | default | undefined |
| 2 | color | string | RGB hex string | optional | #000000 |
| 3 | hidden | bool | whether or not the Category is visible on the chart | optional | false |
¶ Struct: DataPoint
| Key | Field | Type | Description | Requiredness | Default Value |
|---|---|---|---|---|---|
| 1 | x | double | x-value | default | undefined |
| 2 | y | double | y-value | default | undefined |
| 3 | z | double | z-value | optional | undefined |
¶ Union: Data
| Key | Field | Type | Description | Requiredness | Default Value |
|---|---|---|---|---|---|
| 1 | sData | Series | Series data (line and scatter charts) | optional | undefined |
| 2 | cData | Category | Category data (bar and pie charts) | optional | undefined |
¶ Typedef: DataSet
Base Type: Map<String, Data>
¶ Functions
In all functions the chart is specified via the chartID string so it is important to set the id of the element in YML.
¶ Function: Pendant.setChartConfig
void setChartConfig(String chartID, Any config)
    throws IllegalArgument, TException;

void setChartConfig(String chartID, Map<String, Object> config)
    throws IllegalArgument, TException;
Sets the config object of a chart. The format of the config object and its default values is shown below:
{
  title: "",					// (string) title of the chart
  bg: "#ffffff",			// (rgb hex string) background color of the chart margins
  chartbg: "#ffffff", // (rgb hex string) background color of the chart plotting area
  grid: false,				// (bool) toggle grid lines aligning to the axis ticks
  tick: true,					// (bool) toggle tick marks on axis labels
  display: 'none',    // {'none','value','percent'} used for pie and bar charts to display numerical values
  x: {								// (x-axis configuration object)
    label: "",				// (string) x-axis label
    min: -Infinity,   // (float) lower boundary of x-axis
    max: Infinity,    // (float) upper boundary of x-axis
  },
  y: {                // (y-axis configuration object)
    label: "",
    min: -Infinity,
    max: Infinity,
  },
  ry: {               // (right y-axis configuration object) used in multiscale line and scatter charts
    label: "",
    min: -Infinity,
    max: Infinity,
  },
}
¶ Function: Pendant.getChartConfig
Any getChartConfig(String chartID)
    throws IllegalArgument, TException;
Get the configuration object of the specified chart.
¶ Function: Pendant.setChartData
void setChartData(String chartID, Map<String, Data> dataset)
    throws IllegalArgument, TException;

void setChartData(String chartID, Map<String, Data> dataset, boolean right)
    throws IllegalArgument, TException;
Set the dataset for a chart. right can be used to switch between the left and right y-axis for multiscale line or scatter charts.
¶ Function: Pendant.getChartData
Map<String, Data> getChartData(String chartID)
    throws IllegalArgument, TException;

Map<String, Data> getChartData(String chartID, boolean right)
    throws IllegalArgument, TException;
Get the dataset for a chart. right can be used to switch between the left and right y-axis for multiscale line or scatter charts.
¶ Function: Pendant.addChartKey
void addChartKey(String chartID, String key, Data data)
    throws IllegalArgument, TException;

void addChartKey(String chartID, String key, Data data, boolean right)
    throws IllegalArgument, TException;
Adds data to the specified dataset under key if key did not already exist in that dataset.
¶ Function: Pendant.removeChartKey
void removeChartKey(String chartID, String key)
    throws IllegalArgument, TException;

void removeChartKey(String chartID, String key, boolean right)
    throws IllegalArgument, TException;
Removes key from the specified dataset if key already exists in that dataset.
¶ Function: Pendant.hideChartKey
void hideChartKey(String chartID, String key)
    throws IllegalArgument, TException;

void hideChartKey(String chartID, String key, boolean hide)
    throws IllegalArgument, TException;

void hideChartKey(String chartID, String key, boolean hide, boolean right)
    throws IllegalArgument, TException;
Toggles hidden property in key from the specified dataset if key exists in that dataset.
¶ Function: Pendant.appendChartPoint
void appendChartPoint(String chartID, String key, DataPoint pt)
    throws IllegalArgument, TException;

void appendChartPoint(String chartID, String key, DataPoint pt, boolean right)
    throws IllegalArgument, TException;
Appends pt to the series specified by key and right if it exists. Only works for line and scatter charts.
¶ Function: Pendant.appendChartPoints
void appendChartPoints(String chartID, String key, List<DataPoint> pts)
    throws IllegalArgument, TException;

void appendChartPoints(String chartID, String key, List<DataPoint> pts, boolean right)
    throws IllegalArgument, TException;
Appends pts to the series specified by key and right if it exists. Only works for line and scatter charts.
¶ Function: Pendant.incrementChartKey
void incrementChartKey(String chartID, String key, double value)
    throws IllegalArgument, TException;

void decrementChartKey(String chartID, String key, double value)
    throws IllegalArgument, TException;

void incrementChartKey(String chartID, String key)
    throws IllegalArgument, TException;

void decrementChartKey(String chartID, String key)
    throws IllegalArgument, TException;
Adds/subtracts the passed value (or 1.0 in the last two overloads) from the categorical data specified by the chart and key.